

Introduction
That finding sits awkwardly next to how most people are taught to think about risk. A number on a scale, or a BMI calculation, is treated as a reasonably complete answer to the question “how is my metabolic health doing.” The data says otherwise. Two large, independently conducted cohort studies, one tracking metabolic phenotype and physical activity against mortality, the other tracking weight trajectory across pregnancies against 50 years of mortality, arrive at a strikingly similar structural conclusion: a static weight number is a poor predictor of who dies early, and what happens to that number over time, combined with what a person does with their body, predicts far more. This article works through both studies, then applies the finding to a context neither study addressed directly: India, where activity levels, postpartum weight patterns, and BMI thresholds carry their own distinct evidence base.
The Lean Death-Risk Signal
The Korean study, published in Diabetes, Obesity and Metabolism in 2026, followed 442,666 adults from the National Health Insurance Service health screening cohort for a median of 9.3 years.[1] Researchers classified participants into four metabolic-obesity phenotypes using a modified ATP III framework: metabolically healthy lean (MHL), metabolically unhealthy lean (MUHL), metabolically healthy obesity (MHO), and metabolically unhealthy obesity (MUHO).
Against the MHL reference group, MUHL carried the highest all-cause mortality risk of any phenotype (HR 1.23, 95% CI 1.19-1.26) and the highest cardiovascular mortality risk (HR 1.30, 95% CI 1.20-1.42). MHO, by contrast, showed lower all-cause mortality than MHL (HR 0.85, 95% CI 0.81-0.89). MUHO carried no significant excess all-cause mortality risk at all (HR 0.97, 95% CI 0.94-1.01) in the study’s primary model.
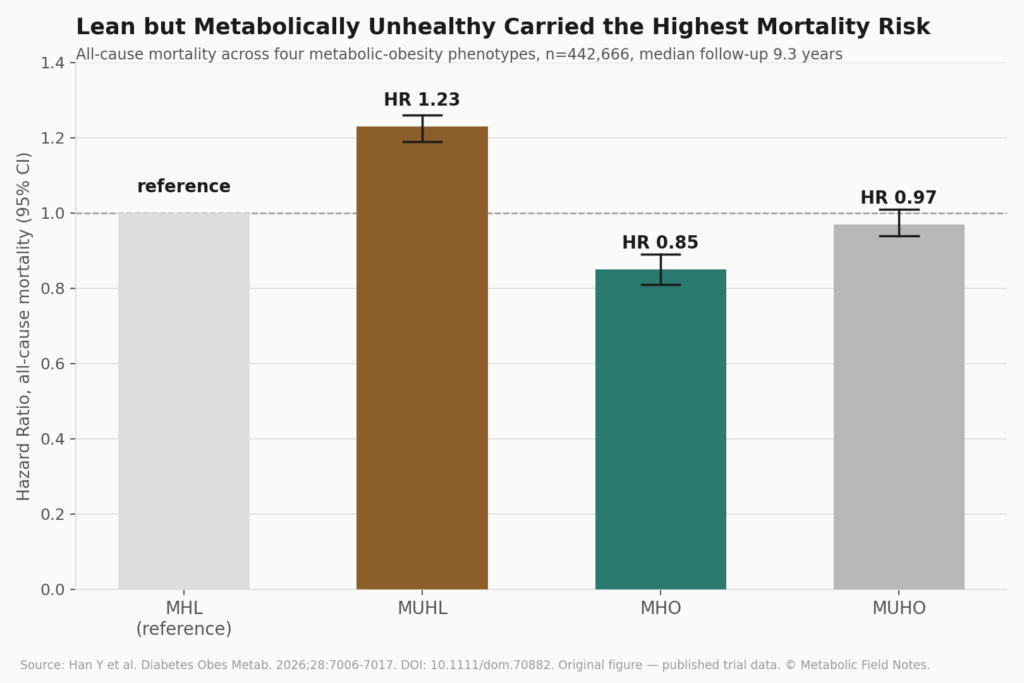
The pattern reverses the assumption that obesity is the dominant risk marker. Here, metabolic dysfunction in a lean body outperformed obesity itself as a predictor of early death.
Why a Single BMI Number Misses the Mechanism
This study defined obesity using the WHO Asia-Pacific cutoff of BMI 25 kg/m2, the same threshold used in Indian clinical guidelines for Asian Indian populations, where cardiometabolic risk clusters at meaningfully lower BMI than in white European cohorts.[1][3] That shared threshold makes the phenotype framework directly relevant, not just analogous, to an Indian reading of this data.
It also connects to a mechanism this publication has covered before. A 2024 controlled overfeeding study found that South Asian men gained the same weight as White European men under identical conditions, yet their insulin sensitivity fell 38% against a 7% drop in the European group, driven by adipocyte cells that had less spare capacity to buffer excess fat, a finding covered in detail in Same Weight Gain, Different Metabolic Risk. The Korean mortality data describes the downstream consequence of that kind of biology at population scale: two people can carry the same BMI and face very different survival odds, because BMI never measured the thing that mattered.
For Indian readers specifically, this reframes what a “clean” BMI reading is worth. A normal weight reading with elevated triglycerides, low HDL, or borderline blood pressure is not a reassuring picture. It is the MUHL profile, and in this dataset, it was the highest-risk group of all four.
Scale matters here too. Of the 442,666 participants, 82,587 were classified metabolically unhealthy lean, close to one in five of the cohort, with a mean age of 53.8 years and a hypertension prevalence of 51.5%, despite carrying none of the excess adiposity that clinicians are trained to flag first.[1] Metabolically healthy obesity, the phenotype with the lowest risk in the primary model, was the smallest group of the four at 64,579 participants. The people conventional risk screening is built to catch were not, in this dataset, the people carrying the most risk.
The One Variable That Moved Risk in Every Phenotype
Physical activity was the second axis of the Korean study, and its effect was consistent across all four metabolic-obesity phenotypes. Compared with no activity, ≥1,500 MET-minutes per week was associated with 25% lower all-cause mortality (HR 0.75, 95% CI 0.71-0.79) and 36% lower cardiovascular mortality (HR 0.64, 95% CI 0.54-0.74).[1] The benefit appeared in a graded, dose-response pattern starting from the lowest activity category, meaning some movement outperformed none well before participants reached the highest tier.
Joint analysis showed that higher activity lowered mortality risk within every phenotype, including MUHO and MUHL, the two highest-risk groups. The interaction between activity level and phenotype was not statistically significant (p=0.75), meaning the protective effect did not depend on which phenotype a person started from. Activity was not a workaround for metabolic dysfunction. It was a lever that worked regardless of it.
This is the part of the data with the sharpest practical relevance for India. The 2017-2018 National Noncommunicable Disease Monitoring Survey, run by the Indian Council of Medical Research, found that 41.3% of Indian adults aged 18-69 do not meet WHO-recommended activity levels, a figure that rises to 52.4% among women and 60.2% among urban women specifically.[4] Against a backdrop where activity itself is the exception rather than the norm, the Korean cohort’s finding that activity benefit holds regardless of metabolic starting point is not an abstract statistic. It describes the one modifiable variable available to the majority of Indian adults who are already carrying some degree of metabolic risk.
The dose-response detail within each phenotype is worth sitting with. Stratified by phenotype, even the MHL group, already the reference for lowest risk, saw all-cause mortality drop further with more activity, from HR 0.87 at 1-499 MET-minutes per week to HR 0.74 at 1,500 or more.[1] The same graded pattern held in MUHL, MHO, and MUHO.
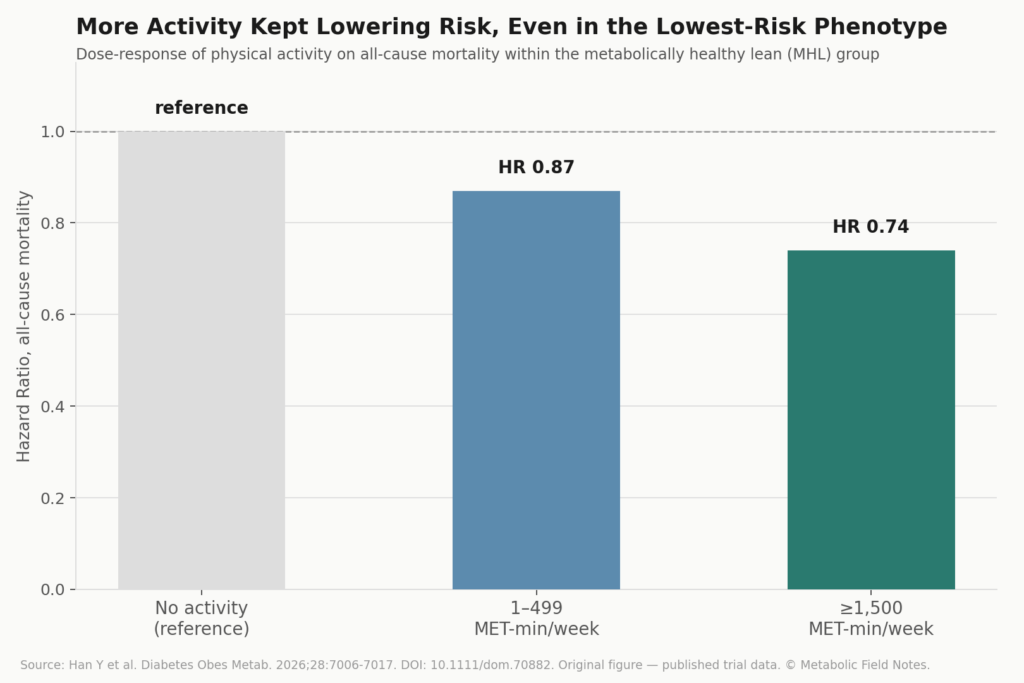
No phenotype reached a ceiling where additional activity stopped mattering within the ranges this study measured, which argues against treating any amount of activity as good enough once a baseline is met, a point that runs alongside our earlier look at how metabolism registers everyday movement.
A Second Window: What Happens Between Pregnancies
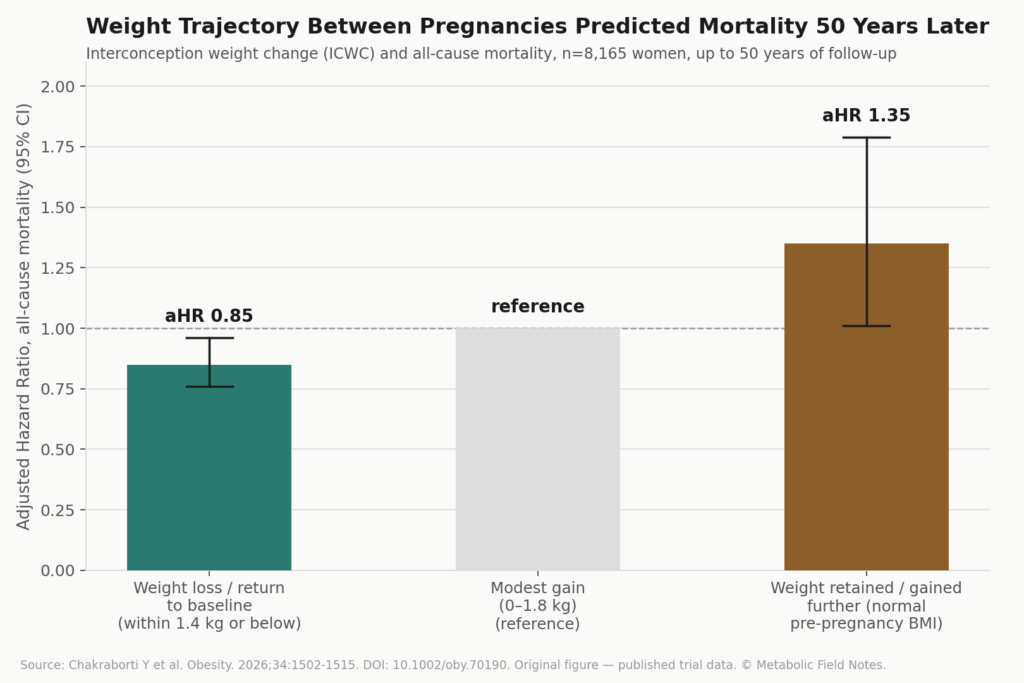
The second study shifts from cross-sectional phenotype to trajectory over time, and from a general population to a specific life stage. Published in Obesity in 2026, it followed 8,165 women from the Collaborative Perinatal Project across two pregnancies, with mortality tracked for up to 50 years.[2] The exposure of interest was not weight at a single point, but interconception weight change (ICWC), the difference in pre-pregnancy weight between a woman’s first and second pregnancies.
Compared with women whose weight rose modestly between pregnancies (0 to 1.8 kg), those who returned to within 1.4 kg of their earlier pre-pregnancy weight, or slightly below it, had an 15% lower risk of all-cause mortality (aHR 0.85, 95% CI 0.76-0.96). The effect was strongest for diabetes-specific mortality, where this group showed a 55% lower risk (aHR 0.45, 95% CI 0.23-0.87). Among women who retained weight or gained further between pregnancies, and who started at a normal pre-pregnancy BMI, the risk of all-cause mortality rose by 35% (aHR 1.35, 95% CI 1.01-1.79). A normal starting BMI did not protect against the consequence of the trajectory that followed it.
A secondary exposure in the same study looked specifically at the interpregnancy interval itself, the weight change between delivery of the first pregnancy and the start of the second. Here the overall association with mortality was not statistically significant, but a clearer signal appeared once the analysis was restricted to women with a normal pre-pregnancy BMI: minimal weight loss during this interval, or outright retention and gain, was associated with a 21% to 35% higher risk of all-cause mortality (aHR 1.21-1.35).[2] The finding narrows to exactly the group most likely to be told their weight is not a concern.
Postpartum weight retention is not a marginal issue in India. A systematic review and meta-analysis of Indian women found that excessive gestational weight gain — a primary driver of postpartum retention — affected a pooled proportion of 16.48% of women studied, and characterises gestational weight gain and postpartum weight retention as a widespread, under-addressed pattern in the Indian context.[5] Gestational diabetes prevalence nationally sits at 22.4%, per the ICMR-INDIAB national study, adding a second layer of metabolic exposure to the same window.[6] The Chakraborti cohort is a U.S. population followed from 1959 onward, not an Indian one, and that gap matters. What it offers is proof that the postpartum window carries mortality consequences that extend across five decades, a claim India-specific data has not yet tested at that time depth, but has already shown the near-term retention pattern for.
Two Cohorts, One Structural Finding
Neither study was designed with the other in mind. One is an East Asian population-health cohort measuring phenotype and activity against nearly a decade of follow-up. The other is a U.S. obstetric cohort measuring weight trajectory across pregnancies against half a century of follow-up. What connects them is not their data, but their shape of finding: in both, a single weight measurement at one point in time explained less than the direction that measurement moved in, or the behavior layered on top of it.
The mechanism is not identical across the two papers. In the Korean cohort, physical activity modifies risk through cardiorespiratory and insulin-sensitivity pathways operating on an existing phenotype. In the U.S. cohort, weight trajectory itself functions as the exposure, plausibly reflecting sustained changes in insulin resistance, inflammatory markers, and cardiovascular strain that a single weight check would miss entirely. Both studies, independently, argue against treating a cross-sectional number as sufficient evidence of metabolic status.
What This Changes in Practice, and What It Does Not
Two things follow directly from this data. Activity level matters at every point on the metabolic-obesity spectrum, not only for people who are already lean or already active. And weight trajectory around pregnancy is a metabolic event with mortality relevance, not merely a cosmetic concern to be resolved before returning to normal life.
What does not follow is a prescription. Neither study tested an intervention. The Korean cohort is observational and Korean; whether its exact hazard ratios transfer to Indian bodies, which carry documented differences in visceral fat distribution and adipocyte behavior even at matched BMI, is a reasonable inference from the shared Asia-Pacific classification framework, not a proven equivalence.[3] The Chakraborti cohort draws from a U.S. population enrolled between 1959 and 1966, with a different smoking prevalence, healthcare context, and demographic composition than a contemporary Indian obstetric population; its postpartum-window finding is suggestive for India, not confirmed in India. Both studies remain observational, meaning activity and weight trajectory are associated with mortality, not proven to cause the reduction in isolation from the many other factors that track alongside them.
Age adds another layer of caution the Korean cohort raises but has not yet been addressed here: when the same phenotype analysis was stratified by age, the pattern partially reversed in adults 65 and older, where MHO and MUHO were associated with lower, not higher, mortality relative to MHL.[1] The authors attribute this to the well-documented obesity paradox in older adults, where BMI-based categories become a weaker proxy for body composition as frailty and lean-mass loss enter the picture. The opening hook above describes adults across the full age range studied; it is not a fixed rule that applies identically at every life stage.
The honest reading is narrower than either data source alone: pay attention to metabolic markers regardless of what the scale says, treat postpartum weight trajectory as a monitored window rather than an afterthought, and default to consistent movement because its benefit held up across every subgroup tested, even where other findings did not.
The recurring error is not measuring weight. It is treating the measurement as the whole answer. Metabolic phenotype and weight trajectory carry information a single BMI reading cannot, and physical activity is the one input in both datasets that moved risk downward without requiring a person to first solve the harder, less controllable question of which phenotype they started in.
Conclusion
None of this argues for abandoning weight as a data point. It argues for treating it as one input among several, alongside metabolic markers, activity level, and, for women, the trajectory of weight around pregnancy specifically. The Korean and U.S. cohorts were built for different populations and different questions, and neither should be read as a finished answer for an Indian reader. What they offer together is a more accurate frame for the next set of questions worth asking, particularly in a population where insufficient activity is closer to the norm than the exception, and where postpartum metabolic monitoring remains inconsistent.
Join the Field Notes
Metabolic Field Notes tracks the evidence as it develops, without protocol-pushing and without hype. If evidence-aware, translational science is useful to you, join the Field Notes.
REFERENCES
[1] Han Y, Choi Y, Lee S, Kim YS. Association of Physical Activity With All-Cause and CVD Mortality Across Metabolic and Obesity Phenotypes. Diabetes Obes Metab. 2026;28:7006-7017. DOI: 10.1111/dom.70882
[2] Chakraborti Y, Mumford SL, Yeung EH, Grantz KL, Mendola P, Mills JL, Caniglia EC, Brensinger CM, Zhang C, Schisterman EF, Hinkle SN. Weight Change Between Pregnancies and Mortality Over 50 Years of Follow-Up. Obesity. 2026;34:1502-1515. DOI: 10.1002/oby.70190
[3] Behl S, Misra A. Management of obesity in adult Asian Indians. Indian Heart J. 2017;69(4):539-544.
[4] National Noncommunicable Disease Monitoring Survey (NNMS), Indian Council of Medical Research – National Centre for Disease Informatics and Research. Prevalence and Correlates of Insufficient Physical Activity Among Adults Aged 18-69 Years in India. J Phys Act Health. 2022;19(3). DOI: 10.1123/jpah.2021-0688
[5] Patel N, Vignesh L, Sagili H, Subitha L. Burden of excessive gestational weight gain and postpartum weight retention among Indian women – a systematic review and meta-analysis. Clin Epidemiol Glob Health. 2023;23:101364.
[6] Mohan V, Deepa M, Tandon N, et al; ICMR-INDIAB Study Group. Prevalence of gestational diabetes mellitus in India: the ICMR-INDIAB national study (ICMR-INDIAB-24). Indian J Med Res. 2025;162:460-469.
Medical Disclaimer: The content on this blog is for informational and educational purposes only and does not constitute professional medical advice, diagnosis, or treatment. Always seek the advice of your physician or other qualified health provider with any questions you may have regarding a medical condition.

Track your symptoms, energy, meals, and questions so your doctor visit is clearer. A tool like TRACKT makes this easy — a short daily log, helps your doctor understand exactly what you’re experiencing.